
Presidential vote share · Uganda 2021
Museveni won 58% of valid votes; Kyagulanyi took 35%.
Source: Electoral Commission of Uganda, declared results of the 2021 presidential election (eleven candidates).
Data / Geography / Systems
Political and institutional analysis often begins with fragmented records, inconsistent identifiers and information collected for different purposes. Polity Lab's data and systems work focuses on making evidence more structured, traceable and useful for analysis, while keeping assumptions and limitations visible.
Uganda in numbers
From the Electoral Commission of Uganda's declared results, district by district. Hover or tap any segment or bar for the exact figure.
Presidential vote share · Uganda 2021
Source: Electoral Commission of Uganda, declared results of the 2021 presidential election (eleven candidates).
Districts won · Uganda 2021
Source: Electoral Commission of Uganda, 2021 presidential results by district. Bar = party of the candidate who led in the district.
Capability areas
The objective is not simply to collect more data, but to improve its consistency and interpretability.
A reliable analytical system begins with well-defined data. This includes source inventories, common identifiers, validation rules, versioning, missing-data checks and documentation of transformations. The objective is not simply to collect more data, but to improve its consistency and interpretability.
Geographic analysis connects records to places and reveals patterns that aggregate tables may conceal. Depending on the research question and available data, this can include mapping, spatial joins, boundary-aware comparisons and analysis of access or distribution. All boundary files and map geometry should come from authoritative, documented sources.
Indicators can help compare conditions, track change and direct attention. They can also mislead when definitions are weak, proxies are mistaken for outcomes or a measure becomes a target. Each framework should state its construct, rationale, calculation, data requirements, interpretation and known failure modes.
A dashboard should answer specific operational or research questions. Useful systems make data freshness, source, uncertainty and exceptions visible; separate signal from noise; and allow users to move from a summary to the underlying evidence. Visual polish cannot compensate for poor data or unclear decision rights.
Monitoring systems are valuable when they support correction. That requires defined reporting responsibilities, escalation rules, audit trails and feedback to the people supplying information. A system that collects reports without testing their reliability or enabling action can create the appearance of control without the substance.
Example from data on file
Polling-station records joined to coordinates and to six presidential elections. National totals for 2016 and 2021 match the Electoral Commission's published figures exactly; differences in earlier years are documented.
Presidential vote share, 1996–2021 (% of valid votes)
Source: Electoral Commission of Uganda, official results. 2006 compiled from polling-station results.
Parliament 2026: directly elected seats (353)
Source: Electoral Commission of Uganda, 2026 directly elected MPs schedule. One dot per constituency seat; four had no result in the schedule. Woman representatives and special-interest seats are not shown.
The same records connect a polling station to its parish, sub-county, constituency and district, and each election to the ones before it. That is what lets a single map, a seat count and a twenty-five-year trend come from one consistent base.
Uganda in depth
Four views of the same country from records on file: how the register has grown, who is on it, how Parliament changed between two elections, and how the 2026 presidential campaign unfolded week by week.
Registered voters, 1996–2025 (millions)
Source: Electoral Commission of Uganda; registers at each presidential election. *2025 is the November 2025 register used for the 2026 election. The register more than doubled, from 8.49m to 21.68m.
Who was on the 2016 register, by age and sex
Source: Commission 2016 register by age band and sex; total 15,277,198 matches the Commission figure exactly. 45.8% of registered voters were aged 18–30; 52.5% were women.
Directly elected MPs by party, 2021 → 2026
Source: Electoral Commission of Uganda; 2021 results and 2026 schedule, 353 constituency seats in each. Woman representatives and special-interest seats are not included.
Comparing seat counts across elections needs consistent definitions: the same type of seat, matched constituencies and a clear record of seats with no declared result. The figures here count directly elected constituency seats only, in both years.
2026 presidential campaign: scheduled events per week, by candidate
Source: published 2026 presidential campaign schedule, 1,190 scheduled events from 29 September 2025 to 12 January 2026, each placed in a district. Scheduled events, not attendance. Hover a week for the figures.

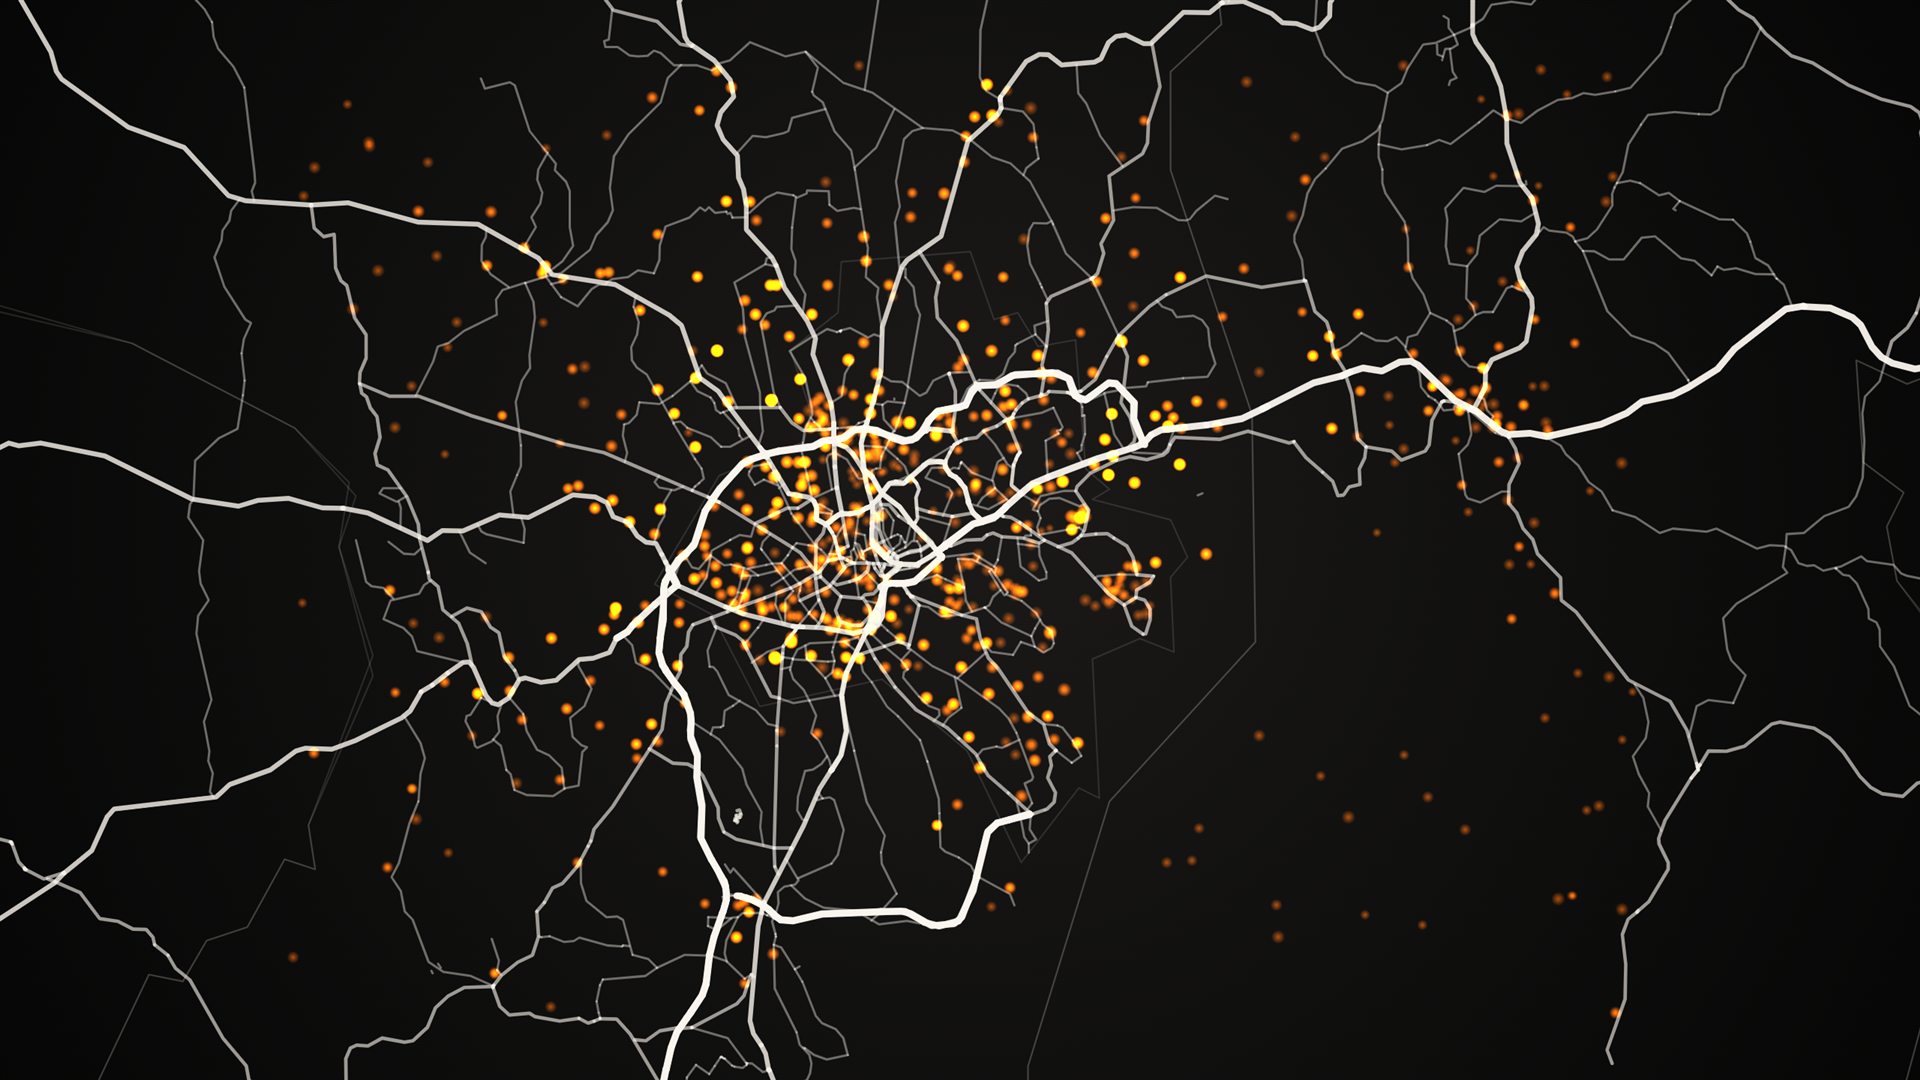
Mapping every geo-located record makes gaps as visible as coverage. Dark areas here are not empty places: they are where station coordinates are not yet on file. That distinction belongs in every analysis that uses the data.
Strategic decision systems
Decision-support systems should help leaders answer defined questions: what has changed, why it may matter, which assumptions are weakest, what requires attention and when a decision must be revisited. Polity Lab's systems-oriented approach links indicators to decision rights, escalation thresholds, review cycles and documented judgement. A dashboard is not a strategy; it is useful only when embedded in a sound decision process.
How we approach a data problem
Responsible use of technology
Automated analysis should be proportionate to the task and transparent about its limitations. Where systems influence public decisions or democratic participation, relevant questions include auditability, contestability, inclusion, representativeness, privacy and the ability to reach a meaningful human review.
Data partnerships
We are interested in data partnerships that improve research quality, documentation and responsible access. Collaboration should establish ownership, permitted use, privacy requirements, attribution and the conditions under which data or derived outputs may be shared.