Independent political intelligence & democratic research
Understand the systems behind political outcomes.
Politics is shaped by more than public narratives and election-day results. It is also shaped by institutions, incentives, organisational behaviour, information flows and the quality of evidence reaching decision-makers. Polity Lab studies these underlying systems through research, electoral analysis and data-informed methods.
0 polling stations geo-located from official records in India and Uganda
Scroll: from the national picture to a single polling station
India · national
97.80 crore registered electors.
Each point is a geo-located polling station from the Polity Lab booth atlas: 7,89,904 of them.
97.80 Crelectors, 2024
10.51 lakhpolling stations
543Lok Sabha seats
4,114assembly seats
Lok Sabha national vote share, 2009–2024 (%)
State
Uttar Pradesh
403 assembly constituencies, 1,60,861 polling stations and 13.53 crore electors at the 2022 Assembly election.
UP Assembly 2022: vote share (%) and seats won
Constituency
One assembly constituency, Uttar Pradesh
439 polling stations · 3.60 lakh electors at the 2022 Assembly election.
Vote share, 2017 → 2022 Assembly (%)
Local variation
Constituency averages hide local variation.
Each polling station's 2022 margin for BJP, the constituency winner, drawn as terrain: raised where it led, lowered where it trailed.
0led by 4+ points
0within −3 to +4
0trailed by 3+ points
Polling stations by margin (percentage points)
Polling station
One polling station
Polling-station result, 2022 (%)
Analysis should preserve that variation rather than hide it behind constituency-wide averages.
Uganda · national
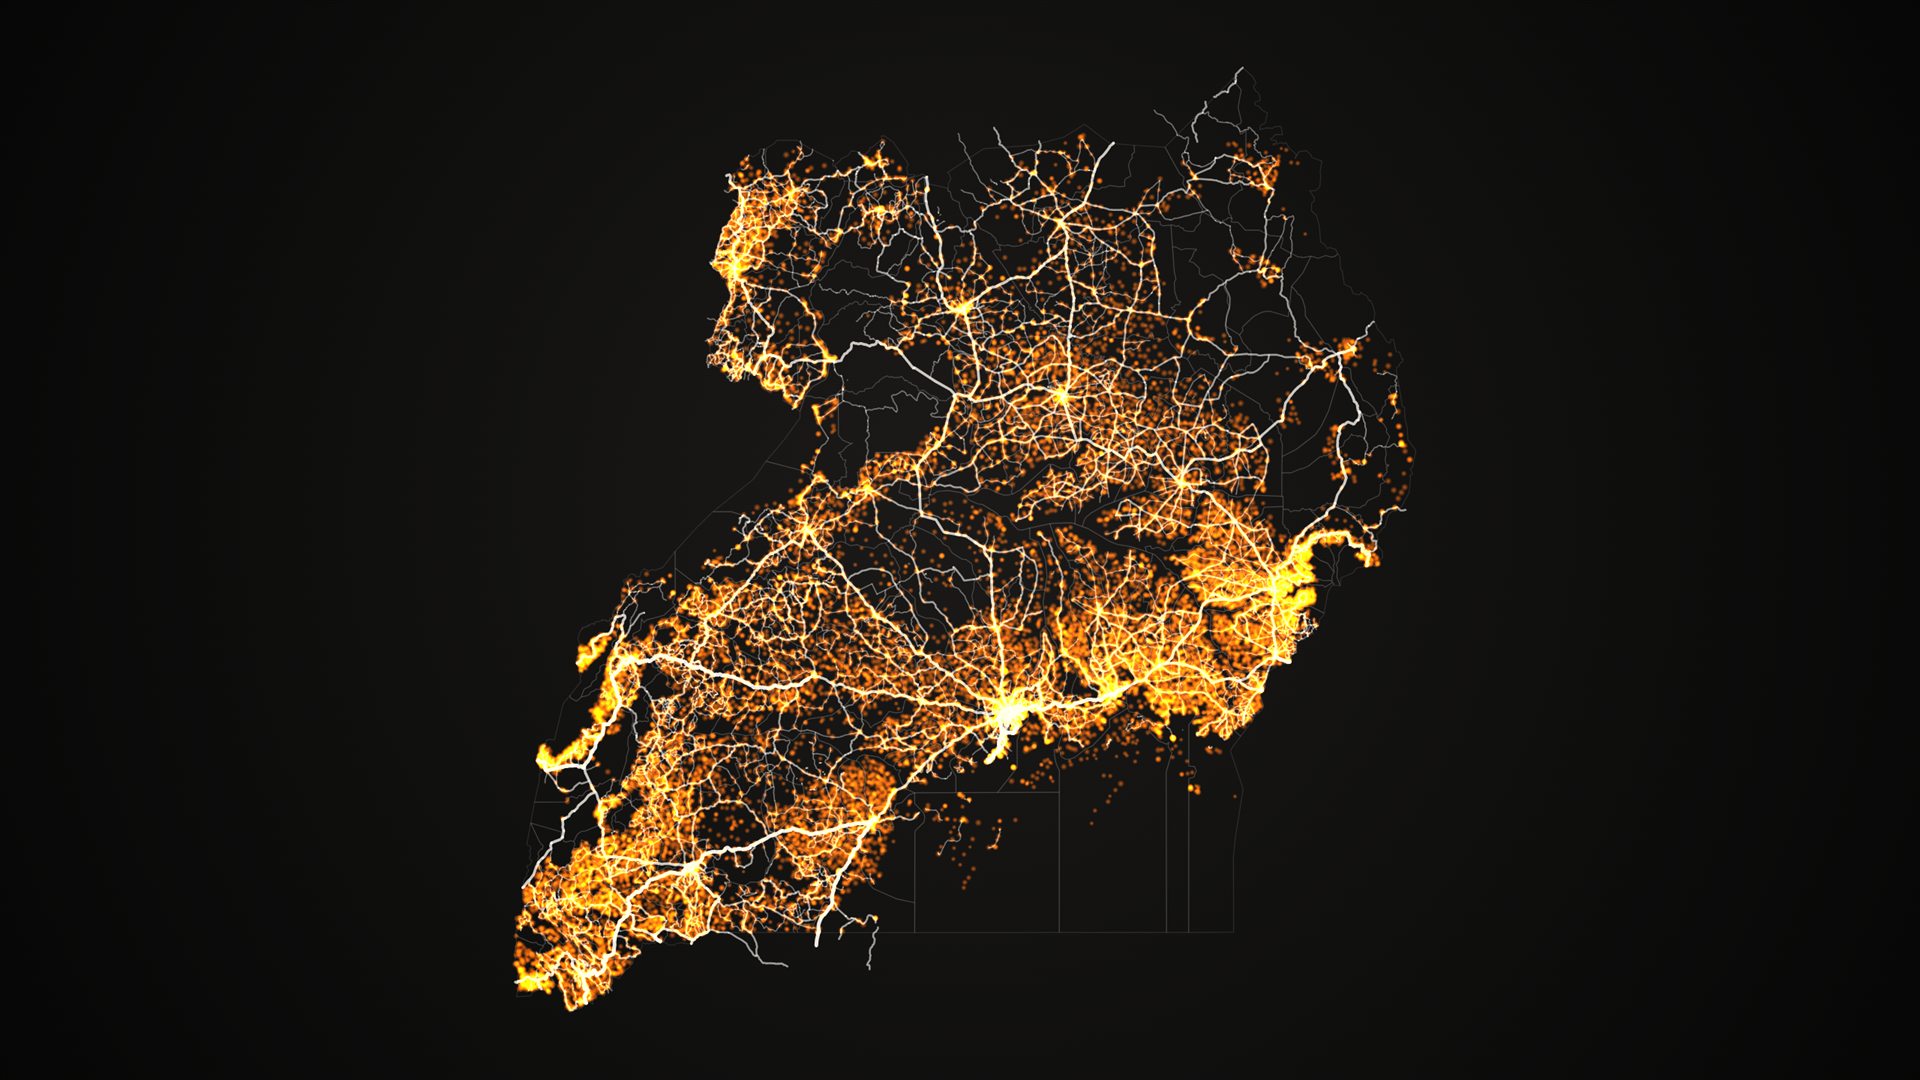
Uganda, district by district.
146 districts, raised by the winning candidate's 2021 share and coloured by party. 23,132 polling stations geo-located from 2016 results. Presidential results since 1996.
Presidential vote share: Museveni and the main challenger (%)Parliament 2026: directly elected seats
Comparative research
Elections ahead.
National elections scheduled in the region over the next two years, as published in national electoral calendars.
Political outcomes emerge from interactions between voters, organisations, institutions, local networks and the information used to make decisions. When these relationships are misunderstood, analysis becomes superficial and organisations become vulnerable to blind spots.
Polity Lab examines the structures beneath the visible event: how information travels, where incentives distort it, how institutions respond, and how political capacity strengthens or deteriorates over time.
What we do
01 / Strategy
Strategy
We examine the political environment, clarify objectives, assess constraints and develop strategic options that connect analysis to execution. This includes strategic diagnosis, scenario analysis, organisational design, decision frameworks and review mechanisms. Strategy is treated as a system of choices and trade-offs, not a list of activities.
02 / Research
Research
We investigate political behaviour, democratic institutions, organisational incentives and the conditions that shape political change. Our work is designed to make complex dynamics more understandable without stripping away context.
03 / Electoral intelligence
Electoral intelligence
We study electoral environments through constituency-level context, polling-station geography, turnout patterns, demographic evidence and organisational factors. The aim is to improve the quality of electoral understanding, not to replace field knowledge with a single score or model.
04 / Data & systems
Data & systems
We organise data and analytical methods into usable systems: structured datasets, geographic analysis, monitoring frameworks, decision-support tools and clear analytical outputs. Data is useful when its provenance, limitations and practical meaning are visible.
Strategy
Strategy is the bridge between intelligence and action.
Polity Lab connects political intelligence with strategic analysis: helping decision-makers interpret the operating environment, test assumptions, identify institutional and organisational vulnerabilities, compare options and understand the consequences of strategic choices. The emphasis is not on slogans or short-term tactics, but on coherent strategy grounded in evidence, political realities and implementation capacity.
Strategic analysis · Political organisation · Electoral systems · Institutional performance · Data-informed decision support
Geographic analysis connects records to places and reveals patterns that aggregate tables may conceal. Two examples, drawn directly from data on file.
An assembly constituency in Uttar Pradesh (not named). Hover for figures. Roads and habitations: PMGSY GIS layers. Polling stations: Polity Lab booth atlas. Drawn from source data, no generated geometry.
Polling-station geography
Polling-station-level analysis can help identify spatial patterns, data inconsistencies and local variation. Reliable interpretation depends on stable identifiers, accurate station locations, boundary awareness, documented source dates and careful handling of station changes between elections.
Uganda. Roads: OpenStreetMap via HOT export (ODbL). Polling stations: Electoral Commission 2016 results with GPS. District outlines: 2021 layout.
Geographic and spatial analysis
Depending on the research question and available data, this can include mapping, spatial joins, boundary-aware comparisons and analysis of access or distribution. All boundary files and map geometry should come from authoritative, documented sources.
Each band is a party family's share of the national vote at every general election from 1951-52 to 2024. The thickness of a band at any point is its share; together they always make 100%. Hover a year for the figures.
Source: Election Commission of India statistical reports for every general election, table "Performance of National Parties". "State parties and independents" is computed as 100% minus all parties recognised as national that year. BJS (1951–71) merged into the Janata Party in 1977; the BJP first contested in 1984. 1984 includes the deferred 1985 polls in Punjab and Assam.
Research and analysis
The quality of a political decision depends on the quality of the information beneath it.
Explore research notes and analytical essays on information distortion, principal–agent problems, organisational performance, electoral vulnerability and democratic accountability.